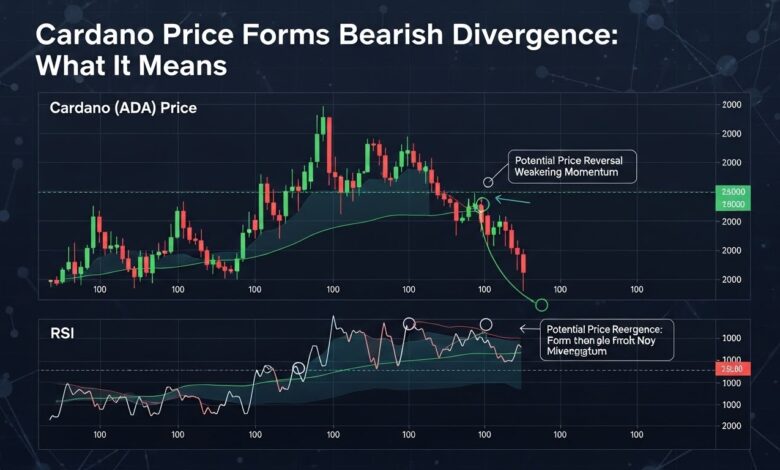
Cardano Price Forms Bearish Divergence: What It Means
Cardano price shows bearish divergence after a 20% jump. Learn what this means for ADA holders, key support levels, and the next move in the market.
After a strong 20% rally, the Cardano price has hit a critical technical roadblock. On the surface, ADA looks healthy: the market has bounced from recent lows and sentiment among traders has improved. At the time of writing, ADA trades near 0.44 USD, attempting to hold on to recent gains while broader crypto remains volatile.
However, beneath the surface, popular momentum tools such as the Relative Strength Index (RSI) and other oscillators are flashing a classic warning signal: bearish divergence. This occurs when price makes higher highs while momentum indicators make lower highs, hinting that the rally may be running out of steam even as the chart still looks bullish on the surface.
For ADA investors and short-term traders, understanding this setup is crucial. A bearish divergence after a sharp move often precedes a pause, a deeper pullback, or even a full trend reversal. In this article, we will break down what this pattern means for Cardano, how traders interpret it, which price zones matter most, and what scenarios could play out next for the ADA price.
What Is Bearish Divergence and Why Does It Matter for Cardano?
How Bearish Divergence Forms on the Chart
In simple terms, bearish divergence shows that price is still climbing, but the strength behind that move is fading. Technically, it happens when:
This mismatch between price and momentum is important because it often appears at or near trend exhaustion. For ADA, a 20% rally that pushes price to a fresh local high while RSI slopes down suggests that new buyers are less aggressive, volume may be thinning, and earlier bulls are gradually taking profit.
Why Traders Watch RSI and MACD on ADA
When ADA surges more than 20% in a short period, RSI often pushes into overbought territory above 70, while MACD prints strong positive bars. If ADA then pushes slightly higher in price, but RSI turns lower and MACD peaks or crosses down, traders say the Cardano price has formed a bearish divergence. This is not an automatic sell signal, but it is a serious yellow flag for late buyers.
The Story Behind Cardano’s Latest 20% Rally
From Local Lows to a Sharp Bounce
The recent 20% move in ADA came as part of a broader altcoin reaction off support. After weeks of pressure and a series of lower highs, Cardano finally found a strong demand zone where buyers stepped in aggressively, triggering short covering and fresh long positions. This squeeze-like rebound is typical in the altcoin market, where liquidity is thinner and sentiment can flip quickly.
For many traders, the bounce felt like the start of a new bullish leg. The Cardano price broke above short-term resistance levels, reclaimed key moving averages on lower timeframes, and social media buzz around ADA spiked again. In that environment, it is easy to ignore warning signs from indicators.
Where the Bearish Divergence Crept In
As ADA extended its 20% rally, the price managed to print a slightly higher high compared to the previous swing. But the RSI on the daily and 4-hour charts started doing the opposite: instead of making a fresh high, it began rolling over. MACD momentum also slowed, with the histogram shrinking and the MACD line flattening against the signal line.
This combination suggests that while the Cardano price looks strong, the underlying fuel driving the move is weakening, which is why experienced traders treat it as a potential trend-change signal rather than noise.
What Bearish Divergence Typically Means for ADA Price Action
Short-Term Implication: Risk of a Pullback or Sideways Phase
Which path ADA takes depends on how price behaves around support levels. If the Cardano price pulls back but holds above previous breakout points, the divergence can simply mark a pause in an ongoing uptrend. If critical supports break with heavy selling volume, it can mark the start of a larger downtrend.
Medium-Term Outlook: Structural Trend Still Matters
It is important to remember that bearish divergence is a momentum signal, not a macro verdict on whether Cardano is a good project. The broader structure of the ADA chart still matters:
For long-term Cardano investors, this pattern is usually a prompt to revisit their thesis and risk management, not necessarily an instant reason to exit a position.
Key Support and Resistance Zones for Cardano After the 20% Hike
Why Support Levels Are Critical When Divergence Appears
When Cardano price forms bearish divergence after a strong hike, support zones become the key battleground. Bulls need to defend these levels to keep the uptrend intact, while bears attempt to push price below them to confirm a reversal.
If ADA corrects to one of these zones and then forms bullish patterns such as higher lows, strong wicks, or a bullish divergence opposite to the current signal, the uptrend can resume. If price slices cleanly through them with rising volume, the bearish case gains weight.
Resistance Zones That Could Cap ADA’s Upside
If ADA fails repeatedly at these zones while momentum continues to weaken, it confirms that the market is not ready to sustain higher prices yet. In such a setup, even small rallies are often sold into as traders anticipate further downside or extended consolidation.
On-Chain and Fundamental Context: Is the Rally Backed by Real Demand?
Whale Behavior and Large Holder Activity
Beyond technicals, on-chain data can help answer a key question: are big players buying the rally, or using it to distribute? When the Cardano price jumps 20%, analysts often watch:
If whale wallets are accumulating and exchange balances are falling, the divergence may represent profit-taking by short-term traders while long-term holders quietly add. If whales are offloading into strength and exchange reserves increase, the bearish divergence gains additional credibility.
Development Progress and Ecosystem Growth
Fundamentals also shape how sustainable a Cardano rally can be. Cardano is a proof-of-stake blockchain that aims to support smart contracts, decentralized applications, and scalable solutions for real-world use cases. Network upgrades, partnerships, and ecosystem growth often drive sustained demand for ADA, while delays or negative regulatory headlines can weaken confidence.
If the 20% move follows positive news, such as a major upgrade rollout or deeper DeFi adoption, the divergence could reflect short-term exhaustion in an otherwise improving environment. If there is no clear catalyst behind the move, the rally may be mostly speculative, making ADA more vulnerable to a sharper correction.
Trading Strategies When Cardano Shows Bearish Divergence
For Short-Term Traders and Swing Traders
Short-term traders who focus on Cardano price action often respond to bearish divergence with tighter risk controls rather than instant panic. Some common approaches include:
The goal is not to be “right” about every signal, but to respect the warning sign that momentum is fading. In a volatile altcoin like ADA, protecting capital during uncertain phases can make a bigger difference to overall returns than chasing the last wave of each rally.
For Long-Term Cardano Investors
However, even long-term investors benefit from understanding technical warning signs. If divergence coincides with negative news, regulatory pressure, or signs of on-chain weakness, it could be a signal to reduce exposure or rebalance a portfolio.
Risk Management: Protecting Yourself When Signals Turn Bearish
Avoiding Emotional Decisions During Volatility
Few things are more dangerous than making emotional decisions during a fast move in Cardano price. After a 20% rally, greed can tempt traders to FOMO in at the top, while a sudden drop after divergence can trigger fear and panic selling.
Important Disclaimer
All discussion in this article is for educational and informational purposes only. It is not financial, investment, or trading advice. Cryptocurrencies like Cardano are volatile and high-risk. Always do your own research and consider speaking with a qualified financial professional before making investment decisions.
Conclusion
When the Cardano price forms bearish divergence after a 20% hike, it is best seen as a sophisticated caution sign rather than an automatic crash alert. The signal tells us that:
For short-term traders, this is a cue to manage risk, consider taking profits, and wait for confirmation before betting on further upside. For long-term ADA holders, it is a reminder to stay informed, monitor both on-chain and technical data, and treat volatility as a normal part of the crypto cycle.
Ultimately, Cardano’s future will depend not only on chart patterns, but also on real-world adoption, developer activity, and macro market conditions. Bearish divergence may cool the current rally, but it does not decide the long-term destiny of ADA. How you respond to it—calmly, strategically, and with a clear plan—matters far more than the signal itself.
FAQs About Cardano Bearish Divergence and ADA Price
What does it mean when Cardano shows bearish divergence after a rally?
When Cardano shows bearish divergence, it means the ADA price has made a new high, but momentum indicators like RSI or MACD failed to confirm that high. This usually signals that buying pressure is weakening and that the recent 20% rally could be losing strength. It often precedes a pullback, consolidation, or in some cases, a trend reversal, although it does not guarantee any single outcome.
Is bearish divergence on ADA a guaranteed sell signal?
No, bearish divergence on ADA is not a guaranteed sell signal. It is a warning that momentum is fading, but price can sometimes continue higher despite the divergence, especially in strong bull markets. Many traders use it together with other signals, such as support breaks, candlestick patterns, or changes in volume, before deciding to exit a position or open a short trade.
How can long-term Cardano investors use this information?
Long-term Cardano investors typically treat bearish divergence as a short-term risk indicator, not a verdict on the project. They may review their exposure, plan for possible volatility, or even wait for pullbacks to accumulate more ADA at better prices. For them, the key is whether the long-term fundamentals, adoption trends, and ecosystem growth remain intact, rather than focusing solely on a single technical pattern.
Which indicators are best for spotting bearish divergence on Cardano?
The most commonly used tools for spotting bearish divergence on Cardano are the RSI and MACD. Traders compare the highs of the ADA price chart with the highs of these indicators. If price prints a higher high while RSI or MACD prints a lower high, the divergence is in play. Some traders also use other oscillators, but RSI and MACD remain the most popular for this type of analysis.
How should beginners approach Cardano when technical signals look mixed?
Beginners should approach Cardano cautiously when technical signals like bearish divergence appear after a 20% hike. A sensible approach is to avoid over-leveraging, keep position sizes moderate, and focus on learning how price, volume, and indicators interact over time. Instead of trying to catch every top and bottom, new traders can prioritize risk management, diversify their portfolios, and use Cardano’s price action as a learning tool while keeping long-term goals in mind.