Bitcoin Oversold RSI Long Entry: Higher High Opportunity
Discover Bitcoin oversold RSI long entry signals on 1H charts. Learn how to identify profitable trading opportunities with technical analysis
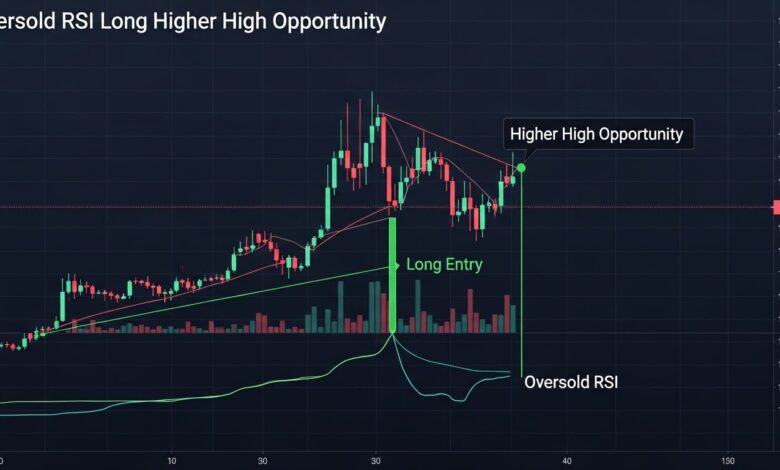
Bitcoin oversold RSI long entry setups emerge on the 1-hour chart, savvy traders recognize these moments as potential turning points that could lead to significant profits. Understanding how to identify and capitalize on these oversold conditions requires a combination of technical expertise, market awareness, and disciplined execution. In this comprehensive guide, we’ll explore everything you need to know about trading Bitcoin oversold RSI signals and positioning yourself for the next higher high.
Understanding Bitcoin RSI and Oversold Conditions
The Relative Strength Index, commonly known as RSI, stands as one of the most powerful momentum oscillators in technical analysis. Created by J. Welles Wilder Jr. in 1978, this indicator measures the speed and magnitude of price movements, oscillating between 0 and 100. When analyzing Bitcoin oversold RSI long entry opportunities, traders typically focus on readings below 30, which traditionally indicate oversold conditions where selling pressure may have reached exhaustion.
For Bitcoin specifically, oversold conditions on the 1-hour timeframe carry particular significance. Unlike traditional markets that operate within set hours, cryptocurrency markets trade 24/7, generating continuous data that makes RSI readings especially responsive to market dynamics. When Bitcoin’s 1-hour RSI dips into oversold territory, it suggests that recent selling has pushed prices to potentially unsustainable lows, creating conditions ripe for a reversal or bounce.
The beauty of Bitcoin RSI indicator analysis lies in its ability to identify moments when market sentiment has swung too far in one direction. Professional traders understand that extreme readings rarely persist, and oversold conditions often precede recovery rallies. However, timing remains crucial—entering too early can expose you to continued downside momentum, while waiting too long might cause you to miss optimal entry prices.
Why the 1-Hour Chart Matters for Bitcoin Trading
Selecting the appropriate timeframe dramatically impacts your trading success, and the 1-hour chart occupies a strategic middle ground for Bitcoin traders. This timeframe provides enough data points to filter out market noise while remaining responsive to intraday price movements. When seeking Bitcoin oversold RSI long entry setups, the 1-hour chart delivers several distinct advantages.
First, the 1-hour timeframe captures meaningful price swings without the whipsaw action that plagues shorter intervals like the 5-minute or 15-minute charts. This stability allows RSI readings to develop more reliable patterns, reducing false signals that can drain trading accounts. Second, 1-hour oversold conditions typically resolve within reasonable timeframes—usually several hours to a few days—making them suitable for both active traders and those with day jobs who can’t monitor markets constantly.
Additionally, institutional traders and algorithmic systems frequently reference hourly charts when making trading decisions. This concentration of attention creates self-fulfilling prophecies where technical levels on the 1-hour chart become particularly significant. When Bitcoin oversold RSI conditions appear on this timeframe, the subsequent recovery often attracts substantial buying interest from various market participants, amplifying potential gains.
Identifying Perfect Bitcoin Oversold RSI Long Entry Points
Recognizing genuine Bitcoin oversold RSI long entry opportunities requires more than simply waiting for RSI to drop below 30. Successful traders employ a multi-layered approach that incorporates confirmation signals, support levels, and market context. Let’s break down the essential components of identifying high-probability entry points.
Confirmation Through Multiple Indicators
While oversold RSI provides the foundation, combining this signal with additional technical indicators dramatically improves success rates. Volume analysis becomes particularly crucial—look for declining volume during the selloff followed by increasing volume as prices stabilize. This volume pattern suggests that selling pressure is exhausting while accumulation begins.
Moving averages offer another layer of confirmation. When Bitcoin’s price approaches or touches major moving averages like the 50-period or 200-period MA on the 1-hour chart while RSI shows oversold readings, the convergence creates powerful support zones. These areas represent natural bouncing points where Bitcoin oversold conditions frequently reverse.
Bollinger Bands complement RSI analysis beautifully. When price touches or breaches the lower Bollinger Band simultaneously with oversold RSI readings, you’ve identified a statistical extreme that historically precedes mean reversion. Smart traders wait for price to move back inside the bands before executing their Bitcoin long entry, ensuring the reversal has begun rather than catching a falling knife.
Support and Resistance Context
Technical patterns don’t exist in isolation—they gain power from their relationship with established support and resistance levels. A Bitcoin oversold RSI long entry setup becomes exponentially stronger when it occurs at or near significant support zones. These might include previous swing lows, round psychological numbers, Fibonacci retracement levels, or high-volume nodes on volume profile charts.
Historical price action teaches us that oversold bounces from strong support levels tend to be more vigorous and sustained than those occurring in no-man’s-land between major levels. Before executing any trade based on Bitcoin oversold RSI signals, zoom out to daily and 4-hour charts to identify where your potential entry sits within the broader market structure.
The Psychology Behind Bitcoin Oversold Conditions
Understanding market psychology transforms mechanical signal-following into nuanced trading artistry. When Bitcoin oversold RSI conditions develop on the 1-hour chart, specific emotional dynamics unfold among market participants that savvy traders can exploit.
Fear drives oversold conditions. As Bitcoin’s price declines, holders experience mounting anxiety, leading some to capitulate and sell at precisely the worst moment. This panic selling creates the sharp downward price movements that push RSI into oversold territory. However, fear has limits—eventually, the most fearful participants have already sold, removing the marginal seller from the market.
Simultaneously, experienced traders and institutions recognize extreme oversold readings as potential opportunity. These sophisticated players begin accumulating positions, providing buying pressure that eventually overwhelms the remaining sellers. The transition from fear-driven selling to opportunistic buying creates the reversal that Bitcoin oversold RSI long entry strategies aim to capture.
Retail traders often make the mistake of selling into oversold conditions, influenced by the psychological discomfort of watching their positions decline. This herd behavior creates the very bottoms that contrarian traders profit from. By maintaining emotional discipline and recognizing that Bitcoin oversold conditions represent opportunity rather than danger, you position yourself ahead of the crowd.
Technical Setup: Building Your Bitcoin RSI Trading System
Creating a robust trading system around Bitcoin oversold RSI long entry signals requires methodical preparation and clear rules. Professional traders don’t improvise—they follow tested protocols that remove emotion from decision-making. Let’s construct a complete trading system you can implement immediately.
Entry Criteria and Trigger Conditions
Your entry checklist should include multiple confirming factors before placing any trade. Begin with the primary signal: RSI on the 1-hour Bitcoin chart must drop below 30, indicating oversold conditions. However, don’t enter immediately—wait for RSI to begin climbing back above 30, confirming that momentum is shifting from bearish to bullish.
Next, verify that price action supports your bullish thesis. Look for candlestick patterns that signal reversals, such as hammer candles, bullish engulfing patterns, or morning star formations. These patterns provide visual confirmation that sellers are losing control and buyers are stepping in. The strongest Bitcoin oversold RSI long entry setups combine oversold readings with textbook reversal patterns.
Volume must cooperate with your analysis. Ideal setups show declining volume during the selloff into oversold territory, followed by expanding volume as the reversal begins. This volume signature indicates that selling pressure has dried up while buying interest accelerates—exactly what you want to see before taking a Bitcoin long entry position.
Risk Management and Position Sizing
Even the best Bitcoin oversold RSI signals can fail, making risk management non-negotiable. Calculate your position size based on a predetermined risk percentage of your trading capital—professional traders typically risk 1-2% per trade. Place your stop-loss order just below the recent swing low that preceded your entry, giving your position room to breathe while limiting downside exposure.
Your risk-reward ratio should favor the reward side by at least 2:1, meaning you’re targeting profits at least twice as large as your potential loss. When entering on Bitcoin oversold conditions, project your profit target toward the next resistance level, the middle Bollinger Band, or a Fibonacci extension level. These technical targets provide objective exit points that prevent emotional decision-making during the trade.
Spotting Higher High Patterns After Bitcoin Oversold Bounces
One of the most powerful aspects of Bitcoin oversold RSI long entry strategies involves the tendency for oversold bounces to create higher highs within the established trend structure. Understanding this pattern recognition skill separates consistent winners from struggling traders.
Recognizing Trend Continuation Signals
When Bitcoin experiences an oversold condition within an established uptrend, the subsequent bounce frequently carries price to new local highs, creating the “higher high” pattern that defines healthy uptrends. This phenomenon occurs because the oversold dip represents a temporary pullback rather than a trend reversal—the brief shake-out of weak hands before the primary trend reasserts itself.
To identify these continuation patterns, analyze the sequence of swing highs and lows leading into your Bitcoin oversold RSI long entry. If the broader structure shows ascending swing lows and highs, your oversold entry likely represents another buying opportunity within the established uptrend. The odds heavily favor your position reaching new highs after the recovery begins.
Market structure provides crucial context for predicting higher highs. When Bitcoin oversold conditions emerge after a series of higher lows, this pattern suggests strong underlying demand supporting prices. Each dip finds buyers willing to step in at progressively higher levels, creating a staircase pattern that leads to new peaks.
Measuring Profit Targets Using Technical Analysis
After entering on Bitcoin oversold RSI signals, determining realistic profit targets separates mediocre results from exceptional performance. Use Fibonacci extensions to project where the recovery rally might exhaust itself. Measuring from the swing low that preceded your entry to the previous swing high, then projecting forward, reveals potential resistance zones where profit-taking might emerge.
Previous consolidation zones also provide excellent profit targets. Bitcoin tends to pause at price levels where significant trading occurred previously, as these areas contain clusters of traders with vested interests in those prices. Marking these zones on your chart before executing Bitcoin oversold RSI long entry trades ensures you have objective exit points planned in advance.
The concept of measured moves offers another targeting approach. Calculate the average distance of previous rallies following oversold conditions on the 1-hour chart, then project that distance from your entry point. While not perfect, this statistical approach provides a reasonable estimate of potential profit based on historical price behavior.
Common Mistakes to Avoid with Bitcoin Oversold RSI Strategies
Even experienced traders fall victim to common pitfalls when trading Bitcoin oversold RSI long entry setups. Recognizing these mistakes before they damage your account dramatically improves long-term results.
The False Bottom Trap
Perhaps the most expensive mistake involves entering too aggressively on the first sign of oversold conditions. Bitcoin can remain oversold for extended periods, particularly during strong downtrends or market-wide corrections. Traders who rush into Bitcoin oversold conditions without confirmation often watch their positions decline further, testing both their capital and psychological resilience.
Avoid this trap by waiting for bullish confirmation before committing capital. Let RSI cross back above 30, observe a reversal candlestick pattern, and confirm that volume supports the reversal. This patient approach might cause you to miss the absolute bottom, but it dramatically reduces the likelihood of catching falling knives—and your profit potential remains strong.
Ignoring the Broader Market Context
Bitcoin oversold RSI signals don’t exist in isolation from the broader cryptocurrency market and traditional financial markets. Traders who focus exclusively on technical indicators while ignoring fundamental factors often find themselves fighting powerful macro headwinds. Before taking any Bitcoin long entry, assess whether significant news events, regulatory developments, or market-wide sell-offs might override technical signals.
Similarly, consider Bitcoin’s correlation with other risk assets. During periods of high correlation with stock indices, a broader equity market decline can suppress Bitcoin recovery rallies even when technical indicators suggest oversold bounces. Incorporating this macro awareness into your Bitcoin oversold RSI long entry decision-making protects you from trades with stacked odds against success.
Advanced Techniques: RSI Divergence and Bitcoin Trading
Elevating your Bitcoin oversold RSI long entry strategy involves recognizing divergence patterns that signal particularly strong reversal opportunities. RSI divergence occurs when price action and the RSI indicator move in opposite directions, revealing underlying shifts in momentum before they become obvious in price movements.
Bullish Divergence Explained
Bullish divergence emerges when Bitcoin’s price makes lower lows while RSI makes higher lows. This pattern indicates that despite price declining, the downward momentum is weakening—each successive decline lacks the selling pressure of the previous one. When this divergence occurs while RSI is in oversold territory, you’ve identified one of the highest-probability Bitcoin oversold RSI long entry setups available.
The power of bullish divergence lies in its forward-looking nature. While price continues declining, momentum is already shifting beneath the surface. Traders who recognize this pattern position themselves ahead of the crowd, entering before the obvious reversal attracts widespread attention. These early entries provide superior risk-reward ratios and allow you to ride larger portions of the subsequent recovery.
Confirming divergence requires patience and precise chart reading. Mark the consecutive swing lows on both the price chart and RSI indicator, drawing trendlines connecting these points. When the price trendline slopes downward while the RSI trendline slopes upward, you’ve confirmed divergence. Combining this pattern with Bitcoin oversold conditions creates exceptionally strong trading setups.
Hidden Divergence for Trend Trading
Hidden bullish divergence occurs during uptrends when price makes higher lows while RSI makes lower lows. This pattern indicates that temporary pullbacks within the uptrend lack conviction, suggesting the primary trend will resume. When these pullbacks push RSI into oversold territory, the resulting Bitcoin oversold RSI long entry represents a trend continuation opportunity rather than a reversal.
Hidden divergence patterns align perfectly with the higher high scenario outlined in our focus keyword. After entering on hidden divergence within an uptrend, Bitcoin frequently surges to new highs as the primary trend reasserts itself. These setups offer the psychological comfort of trading with the dominant trend while providing specific, low-risk entry points.
Real-World Bitcoin Oversold RSI Case Studies
Theory becomes actionable through practical examples. Let’s examine recent instances where Bitcoin oversold RSI long entry strategies delivered substantial profits, extracting lessons applicable to future trading opportunities.
Case Study: December 2024 Bitcoin Bounce
During early December 2024, Bitcoin experienced a sharp correction following regulatory uncertainty news. The 1-hour RSI plunged to 25, creating extreme Bitcoin oversold conditions near the $40,000 support level. Traders who recognized this setup and waited for RSI to climb back above 30 while observing a hammer candlestick pattern secured entries around $40,500.
The subsequent recovery drove Bitcoin to $44,200 within 72 hours, representing nearly 10% gains from the entry point. This rally created a new higher high within the established uptrend, exactly matching the pattern we’ve discussed. The key success factors included patience waiting for confirmation, respecting the support level context, and maintaining predetermined profit targets.
Case Study: Flash Crash Recovery Pattern
Bitcoin’s volatility occasionally produces flash crash events where cascading liquidations drive prices sharply lower before rapid recoveries. During one such event in late 2024, Bitcoin dropped from $43,000 to $39,500 in just 90 minutes. The 1-hour RSI crashed to 18—an extreme Bitcoin oversold RSI reading that rarely occurs.
Traders who maintained discipline and waited for the initial panic to subside found their entry opportunity as RSI recovered to 32 and price stabilized above $40,000. The subsequent rebound carried Bitcoin back to $42,800 within 24 hours. While this case study involved more volatility than typical setups, it demonstrates how extreme oversold readings often precede vigorous recoveries, even after frightening declines.
Integrating Bitcoin Oversold RSI with Other Trading Strategies
The most sophisticated traders don’t rely on single indicators in isolation. By integrating Bitcoin oversold RSI long entry signals with complementary analysis methods, you create robust trading systems with higher win rates and better risk management.
Combining RSI with Elliott Wave Theory
Elliott Wave Theory provides a framework for understanding market cycles and predicting future price movements based on wave patterns. When Bitcoin oversold conditions appear at potential wave 2 or wave 4 corrections within an Elliott Wave structure, the confluence creates powerful entry opportunities. These oversold readings often mark the end of corrective waves before impulsive waves drive prices to new highs.
Traders versed in Elliott Wave can use RSI oversold readings as confirmation that corrective waves have completed. The subsequent entries benefit from both technical indicator signals and wave pattern projections, providing multiple reasons to believe the trade will succeed. This multi-dimensional approach to Bitcoin oversold RSI long entry strategies elevates probability and conviction.
Pairing Oversold RSI with On-Chain Analysis
Bitcoin’s transparent blockchain provides unique data unavailable in traditional markets. On-chain metrics like exchange flows, miner behavior, and accumulation patterns offer fundamental insights that complement technical analysis. When Bitcoin oversold RSI signals align with on-chain data showing accumulation by long-term holders or exchange outflows suggesting reduced selling pressure, you’ve identified exceptionally strong setups.
For example, if RSI shows oversold conditions while simultaneously exchange balances decline and whale addresses increase their holdings, these converging signals suggest smart money is accumulating during the dip. Entering Bitcoin long positions backed by both technical and on-chain confirmation provides extra confidence during the inevitable periods when your position moves against you before recovering.
Time Optimization: Best Times to Trade Bitcoin Oversold RSI Setups
Cryptocurrency markets never sleep, but not all hours offer equal opportunity for Bitcoin oversold RSI long entry strategies. Understanding temporal patterns in Bitcoin volatility and liquidity helps you focus your attention during periods most likely to produce actionable setups.
Market Session Overlaps and Liquidity
Bitcoin trading volume peaks during specific hours when major geographical markets overlap. The period when European and American sessions coincide—roughly 1 PM to 5 PM UTC—typically delivers the highest volume and most reliable price action. Bitcoin oversold conditions that develop and resolve during these high-liquidity hours tend to produce cleaner reversals with better follow-through.
Conversely, oversold readings that emerge during low-volume Asian session hours might lack the participation necessary for robust recoveries. While not impossible, these setups require extra caution and tighter stops. Professional traders often wait for European market open to confirm whether overnight Bitcoin oversold RSI readings will lead to genuine recoveries or simply persist in thin trading conditions.
Weekly Patterns in Bitcoin Volatility
Research reveals weekly patterns in Bitcoin volatility, with Monday and Tuesday often showing increased movement as traders react to weekend news and position for the week ahead. Understanding these rhythms helps you anticipate when Bitcoin oversold RSI long entry opportunities might appear. Similarly, Friday afternoons frequently see reduced volatility as traders close positions before the weekend, potentially offering less follow-through for oversold bounces.
Seasonal patterns also influence Bitcoin trading. Historically, certain months show stronger trends while others consolidate. Adapting your expectations for Bitcoin oversold conditions based on seasonal context—being more aggressive during historically bullish periods and more conservative during typically choppy months—fine-tunes your approach to market realities.
Building a Complete Bitcoin Trading Plan Around RSI Signals
Occasional successful trades don’t create sustainable trading careers—systematic approaches do. Developing a comprehensive trading plan centered on Bitcoin oversold RSI long entry signals transforms sporadic wins into consistent profitability.
Documentation and Trade Journaling
Every serious trader maintains detailed records of their trades, including entry reasoning, market conditions, emotional state, and outcome analysis. When trading Bitcoin oversold RSI setups, document which confirmation factors were present, how long the setup took to develop, and whether your profit targets were realistic. This data accumulation reveals patterns in your decision-making, highlighting both strengths to leverage and weaknesses to address.
Your trading journal should include screenshots of chart setups at entry, along with notes on any divergence patterns, support levels, or volume characteristics. Months later, when reviewing your trading history, these visual records help you recognize similarities in future Bitcoin oversold RSI long entry opportunities, accelerating your pattern recognition skills.
Performance Metrics and Continuous Improvement
Track specific performance metrics for your Bitcoin oversold RSI trading strategy separately from other approaches. Calculate win rate, average win size versus average loss size, maximum drawdown, and return on risk. These quantitative measures reveal whether your strategy maintains positive expectancy—the mathematical edge necessary for long-term success.
Periodic strategy reviews—monthly or quarterly—allow you to assess whether adjustments improve results. Perhaps you discover that Bitcoin oversold RSI long entry setups with bullish divergence outperform simple oversold bounces by 20%. This insight justifies raising position sizes for divergence trades while reducing exposure to standard oversold signals, optimizing your capital allocation based on empirical evidence.
Risk Management Essentials for Bitcoin Oversold Trading
No discussion of Bitcoin oversold RSI long entry strategies is complete without addressing comprehensive risk management. The difference between traders who survive long-term and those who blow up accounts almost always comes down to how effectively they manage risk.
Position Sizing Mathematics
Calculate position size using the formula: (Account Size × Risk Percentage) ÷ (Entry Price – Stop Loss Price). For example, with a $10,000 account risking 2% ($200) on a Bitcoin long entry at $41,000 with a stop at $40,500, your position size should be approximately 0.4 BTC. This mathematical approach ensures that even a series of losses won’t devastate your account.
Never risk more than 2% of your trading capital on any single trade, regardless of how confident you feel about a Bitcoin oversold RSI setup. The markets are unpredictable, and even the highest-probability trades sometimes fail. By capping your risk per trade, you ensure that you’ll survive inevitable losing streaks and remain in the game long enough for your edge to express itself.
Scaling and Pyramiding Techniques
Advanced traders sometimes add to winning positions using pyramiding techniques. If your initial Bitcoin oversold RSI long entry moves favorably, you might add to the position at the next higher low, provided RSI remains in favorable territory and the trend continues. However, only add to winners—never average down on losing positions by adding to trades that move against you.
When pyramiding into Bitcoin oversold conditions that are reversing successfully, each additional position should be smaller than the previous one, and you should move your stop-loss on the entire position to at least breakeven. This approach allows you to maximize gains during strong trends while protecting against sudden reversals that might otherwise turn profitable trades into losses.
The Role of Market Sentiment in Bitcoin Oversold Scenarios
Beyond pure technical analysis, understanding market sentiment provides crucial context for Bitcoin oversold RSI long entry decisions. Sentiment indicators reveal the psychological state of market participants, often reaching extremes that coincide with oversold technical readings.
Fear and Greed Index Correlation
The Crypto Fear and Greed Index aggregates multiple data sources to quantify market emotion on a scale from 0 (extreme fear) to 100 (extreme greed). When this index shows extreme fear while Bitcoin oversold conditions appear on the 1-hour chart, you’ve identified a powerful confluence. History demonstrates that extreme fear readings frequently mark local bottoms, creating ideal conditions for contrarian entries.
Monitor social media sentiment and news flow alongside technical indicators. If Bitcoin oversold RSI signals emerge during peak negative news flow and widespread pessimism, these psychological extremes often precede reversals. The key insight: when everyone feels bearish and has already sold, there’s no one left to sell—creating conditions for price recovery.
Funding Rates and Leverage Positioning
In cryptocurrency derivatives markets, funding rates reveal whether traders are predominantly long or short. Negative funding rates indicate shorts are paying longs, suggesting bearish positioning has reached extremes. When negative funding rates coincide with Bitcoin oversold RSI long entry signals, it suggests that over-leveraged shorts might face forced liquidations during any bounce, potentially amplifying upward momentum.
Similarly, analyze open interest and liquidation data. Large liquidation cascades often push Bitcoin into oversold territory, but they also clear out weak positions, setting the stage for reversals. Understanding these leverage dynamics adds sophistication to your Bitcoin oversold conditions analysis, helping you distinguish between temporary dips and sustained declines.
Tools and Platforms for Bitcoin Oversold RSI Trading
Executing Bitcoin oversold RSI long entry strategies requires appropriate tools and platforms. Your trading infrastructure impacts everything from signal accuracy to execution quality.
Choosing the Right Charting Software
Professional-grade charting platforms like TradingView provide customizable RSI indicators with alert capabilities, allowing you to receive notifications when Bitcoin enters oversold territory on the 1-hour chart. Configure alerts for RSI dropping below 30 and again for RSI crossing back above 30, ensuring you catch both the initial oversold reading and the momentum shift that signals potential entry.
Advanced traders use multiple timeframe analysis within their charting software. While focusing on 1-hour Bitcoin oversold RSI signals for entries, they simultaneously monitor 4-hour and daily charts to understand broader trend context. Multi-timeframe coherence—when oversold readings on the 1-hour chart align with support on higher timeframes—produces the strongest setups.
Exchange Selection and Execution Quality
Not all cryptocurrency exchanges offer equal execution quality. High-volume, reputable exchanges like Coinbase, Binance, or Kraken provide tighter spreads and better liquidity, crucial when executing Bitcoin long entry orders. Slippage on low-liquidity exchanges can substantially erode your profits, particularly when trading larger position sizes.
Consider whether you need spot markets or leverage through derivatives. Spot trading provides straightforward exposure to Bitcoin oversold conditions without liquidation risk, suitable for conservative traders and longer holding periods. Derivatives markets offer leverage but require sophisticated risk management due to liquidation potential. Match your platform choice to your risk tolerance and strategy timeframe.
Tax Implications and Record Keeping for Bitcoin Trading
Successful Bitcoin oversold RSI long entry trading generates taxable events in most jurisdictions. Understanding tax obligations and maintaining meticulous records protects you from compliance issues while optimizing your after-tax returns.
Cryptocurrency Tax Fundamentals
In most countries, Bitcoin trades trigger capital gains taxes. Each time you close a Bitcoin long position for profit, you realize a taxable gain. Short-term gains (positions held less than one year) typically face higher tax rates than long-term gains. Understanding your local tax treatment influences holding period decisions and overall strategy profitability.
Maintain comprehensive records of every trade, including dates, prices, fees, and the reasoning behind each Bitcoin oversold RSI long entry. Specialized cryptocurrency tax software can import exchange data and generate necessary tax reports, simplifying compliance. Failing to properly report cryptocurrency gains exposes you to penalties and interest—don’t let tax issues undermine trading success.
Optimizing Tax Efficiency
Strategic tax planning can significantly improve your after-tax returns from Bitcoin oversold RSI trading. Tax-loss harvesting—selling losing positions to offset gains—reduces your annual tax liability. However, be aware of wash sale rules and equivalent regulations in your jurisdiction that might limit this strategy’s effectiveness.
Consider holding periods when possible. If a Bitcoin oversold conditions trade develops near year-end and your analysis suggests the rally could extend several months, holding beyond one year might qualify the gain for preferential long-term capital gains treatment. Balance tax optimization with trading strategy—never let tax considerations override sound trading decisions, but recognize their impact on net profitability.
Conclusion
The journey to consistently profitable Bitcoin oversold RSI long entry trading combines technical expertise, psychological discipline, and systematic execution. Throughout this comprehensive guide, we’ve explored every dimension of this powerful strategy—from fundamental RSI concepts to advanced divergence patterns, from risk management protocols to tax optimization strategies.
Remember that Bitcoin oversold conditions on the 1-hour chart represent opportunities, not guarantees. The most successful traders approach these setups with prepared minds, tested systems, and controlled emotions. They wait patiently for all confirmation factors to align rather than forcing trades based on incomplete setups. They size positions appropriately, manage risk meticulously, and accept that even the best strategies produce losing trades.
The path forward involves consistent practice and continuous learning. Start by paper trading your Bitcoin oversold RSI long entry strategy, documenting every setup and outcome without risking real capital. This practice phase builds confidence and reveals any weaknesses in your approach. Once you demonstrate consistent profitability in simulation, gradually transition to live trading with small positions, scaling up only as your track record proves your edge.
Bitcoin’s volatility ensures that oversold RSI conditions will continue appearing regularly, providing ample opportunities to implement these strategies. The traders who succeed are those who remain disciplined through winning and losing streaks, who continuously refine their approach based on empirical results, and who treat trading as a business rather than gambling.
Take action today: Open your charting platform, set up RSI indicators on Bitcoin’s 1-hour timeframe, and begin identifying oversold conditions. Mark recent examples where Bitcoin oversold RSI long entry setups would have produced profits. Study these patterns until you can recognize them instantly. With preparation, discipline, and the comprehensive knowledge you’ve gained here, you’re equipped to capitalize on the next higher high opportunity when Bitcoin reaches oversold levels.
See more;Bitcoin’s 2025 Rollercoaster: Will It End on a Low? Expert Analysis